Cost-effective Observability
Collect, store, explore and notify across applications, infrastructure and AI. Manage telemetry collector fleets centrally, with open standards and BYO Grafana.
What to Monitor?
Collection Through to Notification
Bring application, infrastructure and AI telemetry into one platform. Manage collector fleets centrally and connect compatible instrumentation and Grafana dashboards.
Managed Operations
We handle storage, scaling and upgrades. Your team explores telemetry and responds to alerts.
Workload Context
Explore service, cluster and region context across your workloads.
Core Features
Collect & Manage
Collect telemetry across applications, infrastructure and AI, with central collector fleet management.
- OpenTelemetry collection
- Telemetry collector fleets
- Cost-efficient storage
Extended Retention
Managed telemetry storage with retention matched to your workload.
- Up to 1 year retention
- Historical analysis
- Compliance ready
Explore & Notify
Query telemetry, build dashboards and use alerts to support incident investigation.
- Platform exploration
- Notifications and alerts
- Full PromQL support
Enterprise Security
Tenant isolation, encryption, and regional deployment options.
- API key & Bearer token auth
- Data encryption
- RBAC & audit logs
Works With Your Stack
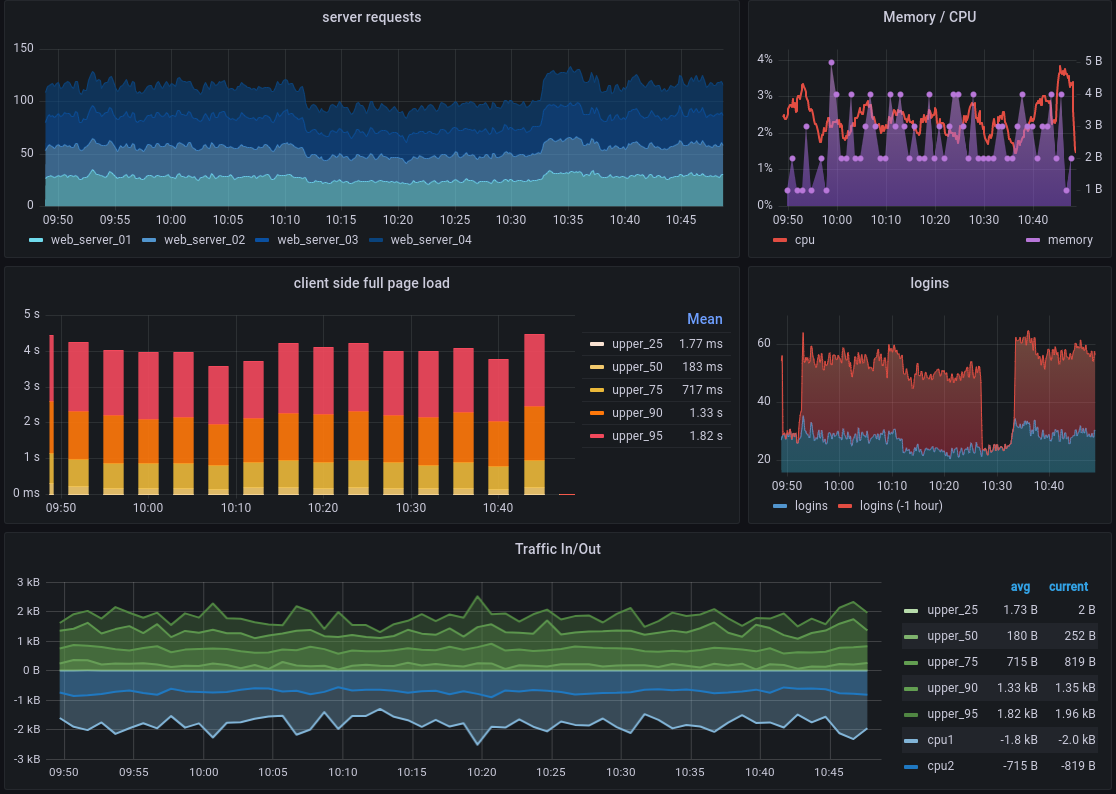
Bring your own Grafana • Full PromQL compatibility • Real-time dashboards
Use Your Existing Tools And Cloud
Keep your existing Grafana instance, dashboards, folders, and team workflows.
- No dashboard migration
- PromQL-compatible queries
- Works with your existing alerting setup
Read your telemetry back out through the same open APIs your dashboards query, for as long as the tenant is open.
- Prometheus-, Loki- and Tempo-compatible read APIs
- EU regions for residency and compliance requirements
- Bulk extract of your history on Enterprise
Simple & Predictable
Free
- 20K active series
- 50 GB/month log ingestion
- 50 GB/month trace ingestion
- 90-day retention
- Community support
Scale
- Metered active series
- Metered log ingestion
- Metered span volume
- Up to 90 days retention
- Priority support
- 99.9% SLA
Enterprise
- Custom retention up to 1 yr
- Bulk data extract
- Use your own Grafana
- Custom SSO
- 99.9% SLA
- Dedicated support engineer
Get Started Today
5-minute setup • No credit card required • Free trial
xScaler Labs
Cost-effective observability across applications, infrastructure and AI