Observabilityfrom your serversto your models.
Infrastructure, Kubernetes, cloud services, application traces and GenAI spans in one OpenTelemetry-native store, with dashboards, drilldown and alerting included. Ask Claude Code, Codex or Cursor about it, and the agent runs the queries itself, signed in as itself, with every change in the audit trail.
Free tier: 20K active series, 50 GB of logs and 50 GB of traces a month, 90-day retention. No card.
Infrastructure · Kubernetes · Containers · Cloud services · Databases · APM · Logs · Traces · Metrics · LLM and agent telemetry · Dashboards · Explorer · Alerting · Snapshots · Live queries from your AI tools





From collection to alerting, one product.
Collection, transport, storage, query and notification sit behind one set of credentials. The agent is a standard OpenTelemetry Collector, the query APIs speak PromQL, LogQL and TraceQL, and we run everything in between.
Stop rebuilding the same query in three places.
The query on screen becomes a dashboard panel or an alert rule without being retyped. A log line carrying a trace_id opens that trace, and a span opens the lines written while it ran, because the link is stored at write time.
Metrics. Every label you kept on the series, one click deep, in PromQL you already have.
Infrastructure monitoring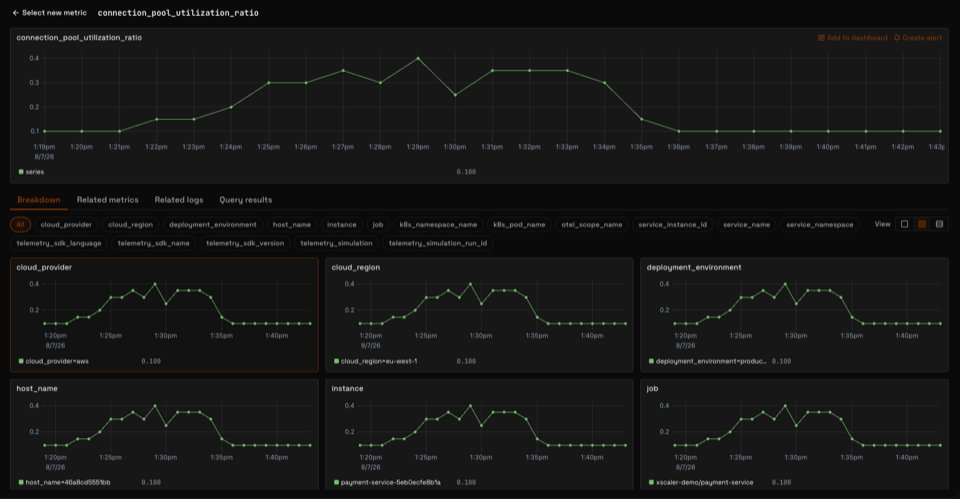
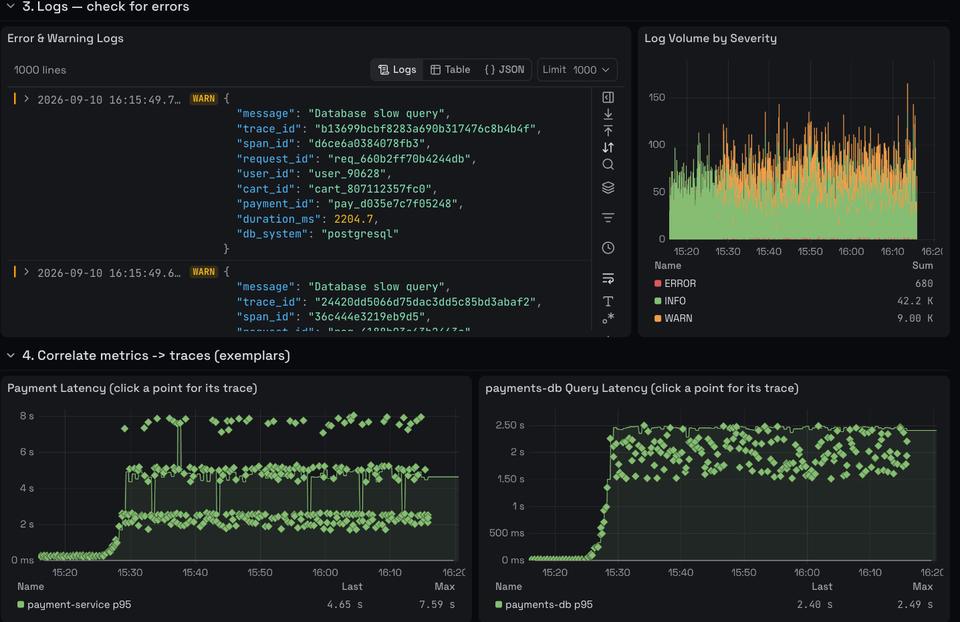
Logs. Search in LogQL. Every line carries the trace_id that opens the trace behind it.
Log management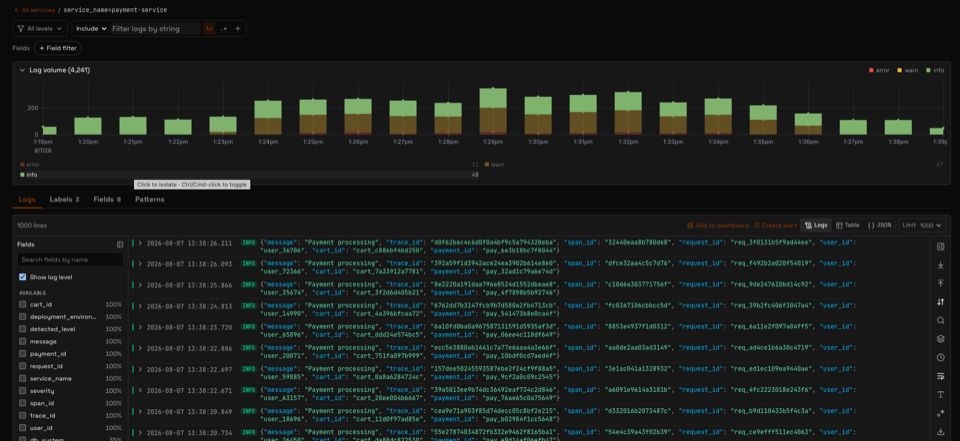
Dashboards. The query on screen becomes a panel. Import existing Grafana JSON and keep version history.
Import Grafana JSON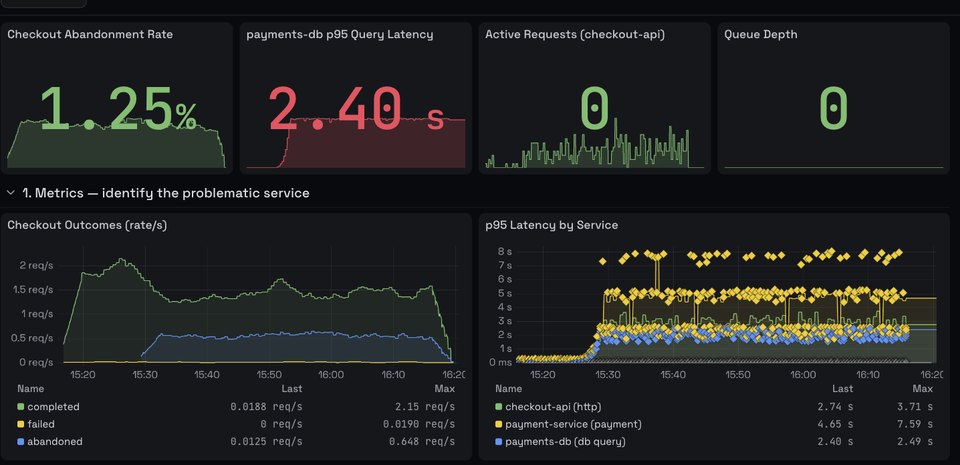
Traces. Ten spans across four services, and the SQL statement sits on the span that ran it.
Application performance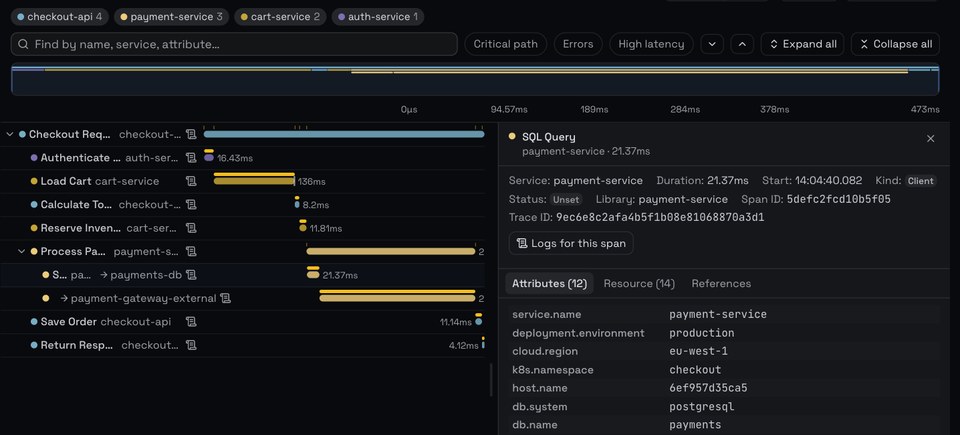
Service graph. The same trace as a graph, each edge carrying the time spent crossing it.
Application performance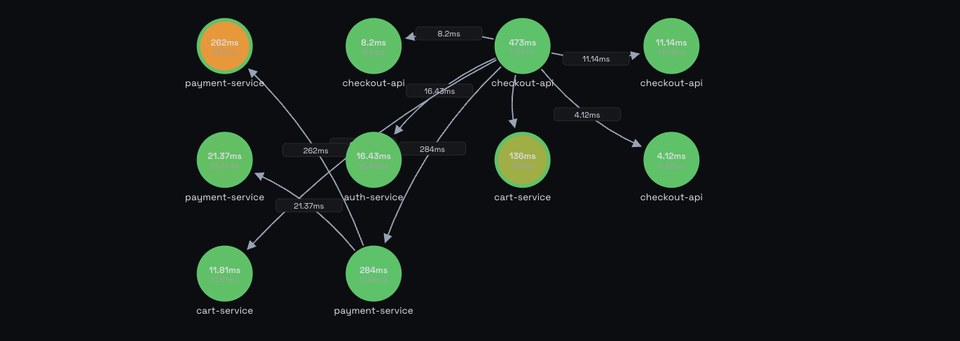
Snapshots. Freeze what is on screen to a link, so the incident channel reads your window rather than rebuilding it.
read-only linkAlerts. The same query becomes a rule, with contact points, notification policies, silences and mute timings.
Alert rules and contact points
Every model call is a span.
An application that calls a model has two costs your existing dashboards cannot see: tokens, and the latency of somebody else's inference. Your app emits OpenTelemetry GenAI spans through the OTLP exporter its SDK already has, and each one carries the model, the operation, the token counts and the finish reason.
The span sits inside the request that triggered it, so a slow endpoint shows the inference time in the waterfall rather than an unexplained gap. Token usage and call duration arrive as histograms split by model and operation.
Which model is burning the budget, whether p95 moved, how many calls failed.
Agent frameworks that emit OTel spans land the same way, one span per step.
No second collector to run and no separate AI product to switch on.
The provider and the model come off the span itself, in gen_ai_request_model. Nothing here is a separate integration to switch on.
Your coding agent can run the queries.
Connect Claude Code, Codex, Cursor or any MCP client to your tenant. It writes the PromQL, LogQL and TraceQL itself, so you ask in English and it goes and looks rather than waiting to be handed a log paste.
There is no API key to leak. Whoever connects signs in through the browser and ticks the capabilities the connection may use, and it never exceeds that person's role.
Query metrics, logs and traces, and walk a metric to the trace behind it to the lines around a span.
Read your dashboards, alert rules and firing alerts, and see where a notification routes.
Build a dashboard or write an alert rule from what it found, inside the capabilities you granted.
Nothing it can do deletes anything, and every change it makes is attributed in the audit trail.
Every client is added by a person, through your own sign-in, and can never do more than that person's role allows. Revoking the person revokes the client with them.
Three signals, one store, one set of credentials.
Prometheus remote_write and OTLP in, PromQL out.
Keep the pod, region and trace_id labels you would otherwise strip to keep a bill down. Query them with the PromQL your dashboards already contain.
remote_write · OTLP/HTTP · OTLP/gRPCNative push and OTLP in, LogQL out.
Structured and unstructured lines from the agent, Fluentd, Vector or Logstash. There is no Elasticsearch cluster to size, shard or reindex.
native push · OTLP/HTTP · OTLP/gRPCOTLP in, TraceQL and Jaeger out.
Span waterfall, critical path, service graph and exceptions, with the log lines written while a span ran one click away.
OTLP/HTTP · OTLP/gRPCThe link between a metric point, the trace that produced it and the logs written during that span is kept at write time. A log line carrying a trace_id opens that trace, and a span opens the lines around it. Nothing is joined at query time.
You edit one config block.
The agent is a standard OpenTelemetry Collector. You write the opamp extension on the host once. Every receiver, processor and exporter after that arrives from the portal, versioned, with secrets resolved on the agent rather than checked into a repo.
Enrol with a token. Push a pipeline change to one agent or to the whole fleet.
eBPF instrumentation reads CPU, memory, network and I/O with no code changes.
Trace auto-instrumentation attaches to Kubernetes workloads you cannot rebuild.
Each tenant lives in the region you pick.
A tenant is the isolation boundary: its own endpoints, its own token, its own data. You choose its region when you create it, and one account holds as many as you need, so an obligation to keep data in one place costs you a tenant rather than a second contract.
The region is set when the tenant is created, and everything written to that tenant stays in it.
An agent enrols into one tenant, so where a host reports decides where its telemetry lands.
Every read names its tenant, so a token for one is not a token for another.
All of them arrive on one bill, on the Scale plan and above.
Read it in Insights, or in the Grafana you already run.
The Prometheus-, Loki- and Tempo-compatible query APIs stay open, so the dashboards and alert rules your team already maintains keep working unchanged.
Bring your own Grafana
Add xScaler as three data sources. Existing dashboards, folders and alert rules keep working, and Grafana's alerting engine queries xScaler like any other Prometheus or Loki source.
Or anything else that speaks them
The Jaeger UI, OpenSearch Dashboards, a notebook, a script in CI. Anything that can talk to a Prometheus, Loki or Tempo API can read your tenant, which is also what makes leaving cheap.
Prometheus · OpenTelemetry SDKs · OTel Collector · Grafana Alloy · Fluentd · Vector · Logstash · Kubernetes · Docker · Linux · Windows · AWS · Azure · GCP · Postgres · MySQL · MongoDB · Redis · Nginx · Elasticsearch · Go · Python · Node.js · GenAI SDKs · agent frameworks
Priced on what you send.
One plan, one bill. Metrics, logs and traces are meters inside it, not three products to buy, and Insights, the MCP server and the open query APIs are on every plan including the free tier.
Scale
MOST TEAMS START HEREOne package for all three signals. No series or volume ceiling to plan around.
Get started →Enterprise
ANNUALCustom limits, retention up to a year, custom SSO and a dedicated engineer.
Book a call$19 a month for the platform, then $0.002175 per active series, $0.45 per GB of logs and $0.45 per GB of traces.
One base fee, one bill. You are not buying metrics, logs and traces separately.
Questions we get on the first call.
Something not here? Book thirty minutes with an engineer who works on the platform. Book a call →
- Do we have to replace our current stack?
- No. Ingest is Prometheus remote_write and OTLP, so your collectors keep writing. The query APIs are Prometheus-, Loki- and Tempo-compatible, so your dashboards and alert rules keep reading.
- What happens to our data if we leave?
- The same open APIs that let your Grafana read the tenant let you read it out, and they stay open until the day you stop paying. On Enterprise we run the bulk extract for you and hand over the history, so you leave with what you put in.
- Is the agent really just an OpenTelemetry Collector?
- Yes. You write one opamp extension block on the host. Every receiver, processor and exporter after that arrives from the portal, versioned, with secrets resolved on the agent.
- How much do we have to instrument before we see anything?
- Nothing, to start. The eBPF sensor reads CPU, memory, network and disk with no code changes, and trace auto-instrumentation attaches to Kubernetes workloads you cannot rebuild. SDK instrumentation buys detail rather than basic coverage.
- What actually makes the bill jump?
- Cardinality. Labels carrying unbounded values (user IDs, request IDs and session tokens) grow series faster than traffic does. A query in the docs ranks your worst offenders, and the agent can drop those labels before they are ever billed.
- Is it safe to let a coding agent near production data?
- No API key is involved. Whoever connects signs in through the browser and ticks the capabilities the connection may use, and it acts as that person without ever exceeding their role. Nothing it can do deletes anything, and every change it makes is attributed in the audit trail.
- Do the models we ship need a separate product?
- No. GenAI spans leave through the OTLP exporter your SDK already has, into the same agent, with the same two headers. They read back in Insights next to the rest of your telemetry.
- What are the hard limits?
- Thirty labels per series, 1,024 characters for a label name and 2,048 for a value, 2,000 samples per remote_write request, and a two-minute query timeout. Series and volume ceilings are plan-dependent.